Working with Auto Scaling Groups
Working with Auto Scaling Groups
#380460
The Auto Scaling Groups (ASG) tab displays optimization opportunities for AWS Auto Scaling groups discovered through CloudWatch data collection. Optimization opportunities include group sizing and instance type recommendations based on predictive workload analytics.
When working with ASGs, note the following:
- EC2 instances that belong to an ASG are logically treated as part of the ASG service entity and recommendations are made for the group and not for the individual instances.
- Auto Scaling groups configured with maximum group size = 1, are only included in the EC2 tab; ASGs configured with maximum group size > 1, are included in the Auto Scaling Groups tab.
- If an ASG is associated with an ECS or EKS service, the Densify analysis requires additional information to ensure the ASG can satisfy all of the container reservation requests. Additional data should be collected by deploying the Densify container data forwarder into this cluster. Contact [email protected] for details.
- ASGs configured to use the 'Combined Purchasing Options and Instance Types' feature will have an attached policy that defines the mix of instance types on which the ASG can run. Densify cannot analyze these ASGs. However, an ASG with a mixed policy attached, can still be configured to run on one instance type. These ASGs can be analyzed.
- If memory data is not available for ASGs, memory utilization of the parent ECS or EKS service will be used and if that data is also not available, the backfill memory settings will be used for the analysis. See ASG Backfilling Memory.
Densify parses the mixed policy, attached to the ASG to determine if the ASG is actually configured to run a mix of instance types or on a single instance type.
The ASG optimization opportunity report is divided into two sections:
- The tabular report in the upper pane, shows details of the ASGs and their recommendations.
- Tabs in the lower pane display the selected ASG's predicted scaling activity and resource utilization details. A third tab shows the effort required to implement the recommendations.
The controls, in the upper right corner of the page, provide options for managing and viewing your data more effectively.


By default the table is sorted by Efficiency Rating. This is still the case even if you select another Group By option. You can sort the content of this table using any of the available columns, by clicking the column header.
- Click the column header to sort the table, in ascending order, using the content of the selected table as the sort key.
- Click the column header again, to sort the table, in descending order, again using the content of the selected table as the sort key.
- Click the column header a third time to clear the sort and return to the default, sorted by Efficiency Rating.
An up/down arrow is displayed in the column header to indicate the column is being used to sort the content of the table.
Sorting is not persistent between pages or login sessions and this feature is only available on the Data tab.
The ASG tabular report is ordered based on the following sorting keys:
Table: ASG Sort Key Priority
|
Sort Key |
Description |
|---|---|
|
The Auto scaling groups are first sorted by Overall Status, in the following order:
|
|
|
If the Overall Status is the same, then the secondary sort key is Optimization Type. ASGs are sorted by Optimization Type in the following order:
|
|
|
3. Account |
If Overall Status and Optimization Types are the same for the ASGs, then the tertiary sort key is the Account number, in ascending order. |
|
4. Auto Scaling Group name |
If all of the above sort keys are the same, then the final sorting is done by the Auto Scaling group name, in ascending, alphabetical order. |
You can filter the ASG optimization tabular report based on recommendations using the Recommendation Filter Menu. This filter allows you to narrow the results of your report based on overall status, optimization type, effort required and whether or not the recommendation should be deferred. For details, see
The tabular report displays the current and recommended instance sizing and cost details for each ASG associated with downsizing, upsizing, or modernizing the instance type in the ASG's configuration. See the recommended Instance Type column for instance sizing recommendations.
The report also displays recommended group sizing associated with downscaling or upscaling the ASG. See the Min Group Size or the Current Maximum Size columns for the recommended group size. Refer to Reviewing the ASG Optimization Opportunity Report Columns for a description of the ASG tabular report columns.
Reviewing Specific Instance Details
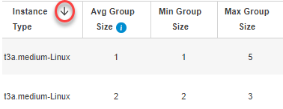
The bottom pane of the ASG report provides the following information for the ASG, selected in the tabular report:
- Metrics Viewer—The link in the upper right corner of the lower pane, opens the metrics viewer. You can use the metrics viewer to investigate details when deciding whether to action specific recommendations. See
- In Service Instances—Shows workload charts for current and recommended predicted scaling activities for the selected ASG. For ASGs identified as "Just Right" or "Terminate" (optimization type), only the current in-service auto scaling activity chart is displayed.
- ASG Utilization —Shows charts for current and recommended CPU Utilization, Memory Utilization for the selected ASG. Network I/O, Disk I/O workload charts are also included, showing utilization at the ASG level. For ASGs belonging to ECS clusters, additional CPU and Memory Reservation charts are displayed. You can view workload charts for each group member from the In-Service Instance Details Page page.
- Effort Details Tab—This table lists the factors that contribute to the effort required to investigate and implement the Densify recommendations. Effort for each group is calculated by rule-driven analytics based on factors (such as instance family change, data quality checks, feature changes, etc.) that can be configured in the policy settings and through analysis rule sets. A description of each rule and its impact on the effort to implement the recommended changes are provided.
Reviewing the ASG Optimization Opportunity Report Columns
Table: ASG Optimization Opportunity Report Columns
|
Column Name |
Description |
||||||
|---|---|---|---|---|---|---|---|
|
The AWS linked account containing the Auto Scaling group. |
|||||||
|
Region |
The region containing the Auto Scaling group. |
||||||
|
The AWS EC2 Auto Scaling group name, discovered from data collection. The Auto Scaling group name is a hyperlink that opens the Impact Analysis and Recommendations report, from which you can review group-specific details. See |
|||||||
| A unique key assigned by the public cloud vendors to identify this instance. This column is hidden by default. You can enable it for display, as required. See Data Controls, above. |
|||||||
|
This column indicates the name of the Kubernetes cluster that the ASG is hosting. The analysis may require additional information to ensure the ASG can satisfy all of the container reservation requests. If the selected ASG is hosting a Kubernetes cluster and has no EKS Reference, or if the ECS/EKS Reference column is not visible, additional data should be collected by deploying the Densify container data forwarder Note: This column is visible only if the Auto Scaling group is hosting a Kubernetes cluster. |
|||||||
|
The name of the ECS or EKS cluster associated with the Auto Scaling group. The additional cluster-level information is used for enhanced ASG analysis, resulting in more accurate recommendations. The ECS reference is to the ECS cluster, and for EKS, the reference is to the Kubernetes node group or cluster. Note: This column is visible only if the Auto Scaling group uses an ECS or an EKS instance. When the ASG is associated with a Kubernetes cluster the Densify analysis requires additional information to ensure the ASG can satisfy all of the container reservation requests. If an ASG, hosting a Kubernetes cluster, has no EKS Reference, or the column is not visible, additional data should be collected by deploying the Densify container data forwarder For ECS services, capacity providers can be used to manage the infrastructure that the tasks in your clusters use. Capacity providers for ECS allow for multiple ASGs to support an ECS cluster. The reference in this column accounts for created capacity providers and indicates the ECS service cluster that is associated with this ASG. There will be an impact to the effort value for ASGs, hosting a Kubernetes cluster, and not linked with a ECS/EKS reference (i.e. has no parent). |
|||||||
|
The current catalog instances is listed. This value is based on the data collected. |
|||||||
|
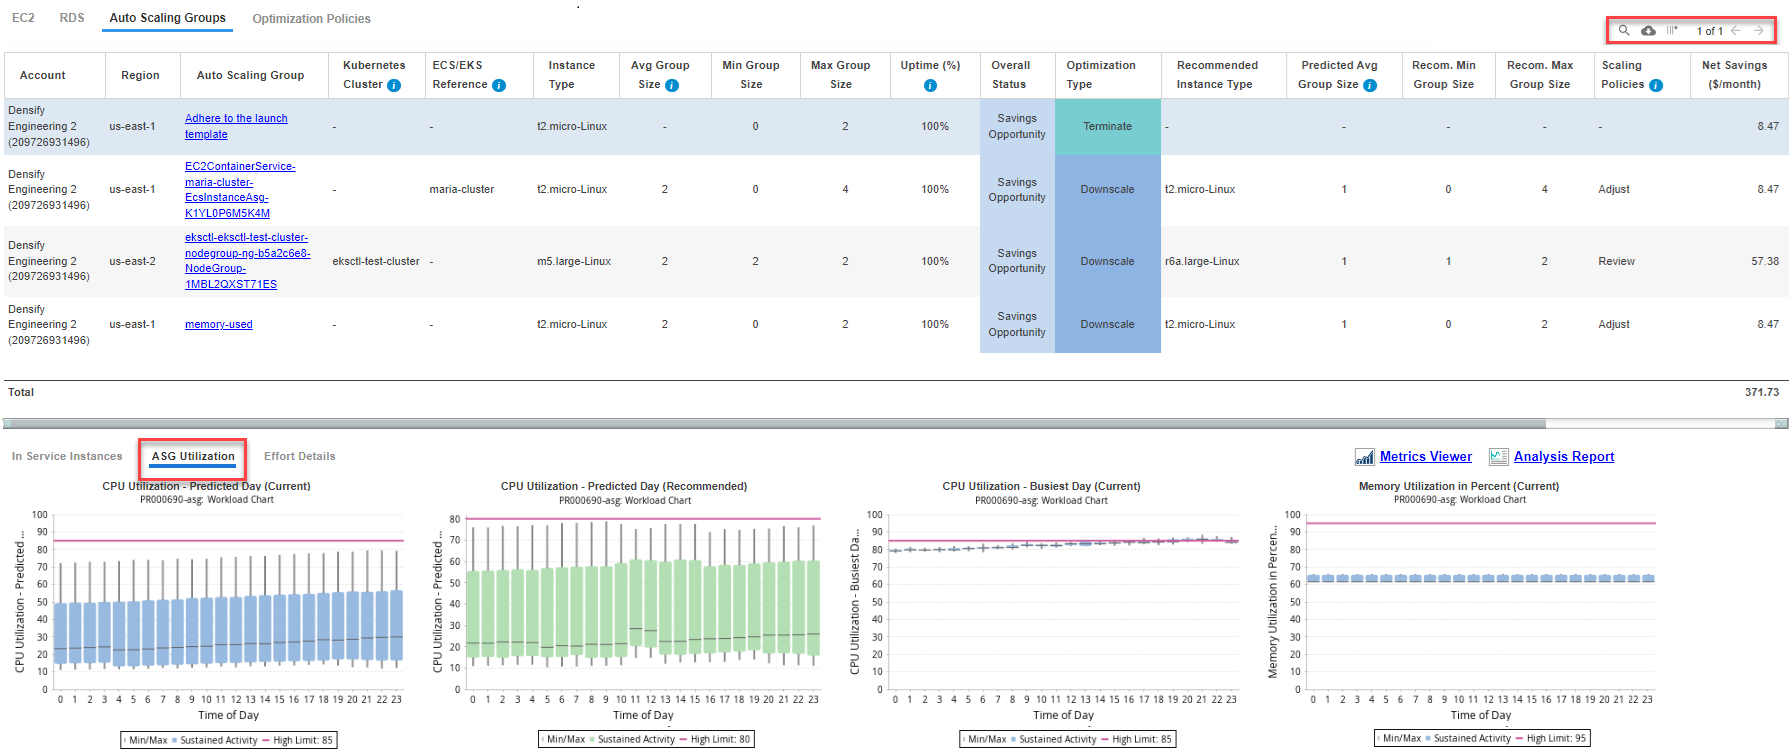
Avg Group Size |
The average instance count when the ASG is running. |
||||||
|
The minimum number of instances/hour currently configured in the scale group. |
|||||||
|
The maximum number of instances/hour currently configured in the scale group. |
|||||||
|
Total Hrs |
The total number of hours since the ASG was created. This column is hidden by default. You can enable it for display, as required. See Data Controls, above. |
||||||
|
Running Hrs |
The number of hours that the ASG has been running. This column is hidden by default. You can enable it for display, as required. See Data Controls, above. Both Total Hrs and Running Hrs are restricted by the historical time range defined in the policy (i.e. 60d history). |
||||||
|
Uptime (%) |
The Predicted_uptime%, and not the observed uptime percent. When using pay-per-use pricing models, the amount of time each instance has been running, is required to accurately estimate future costs. The predicted uptime (%) for an instance or container, is based on the percentage of hours CPU utilization data is present in the historical interval, as specified in the policy settings for the ASG. Individual child instances are not taken into account. Predicted uptime %, for new instances or containers, that started mid-way through the historical interval, is calculated from the time/date that the instance was started as opposed to the beginning of the interval, resulting in more accurate predictions for future usage. For example, the uptime is the number of hours that have "CPU Utilization in mcores", and the range is the lesser of when the container was discovered, or the range defined in the policy. Looking at a specific container that was discovered on Jan 5th 2023, that has workload of 42 hours since that date, then the uptime % is 42 hrs/(13 days x 24 hrs/day) = 13.4%. This is the value is shown in this column. |
||||||
|
Life Cycle |
This is the instance market option configured for the Auto Scaling group.
This column is hidden by default. You can enable it for display, as required. See Data Controls, above. |
||||||
|
Identifies the overall status of the optimization results based on Optimization Type and potential Net Savings ($/Month) :
|
|||||||
|
The recommended action for the group of instances. See |
|||||||
|
Recommended Instance Type |
Based on optimization analysis, the recommended catalog instances is listed. |
||||||
|
The predicted average instance count on the recommended instance type. |
|||||||
|
Recom. Min Group Size |
The minimum number of instances recommended for the scale group. |
||||||
|
Recom. Max Group Size |
The maximum number of instances recommended for the scale group. |
||||||
|
The estimated cost savings per month. The predicted average instance counts, the instance type cost and predicted uptime are used to calculate the current and recommended estimated cost. The savings are calculated as the current estimated cost minus the recommended estimated cost. |
|||||||
|
If the current and predicted average group size differ, then to better match the ASG capacity with the observed demand, adjust the scaling polices when there is no other recommended change or review the scaling policies when there is another recommended change. Possible values are Adjust, Review or Keep.
|
|||||||
|
[ High | Medium | Low | None ] This column describes the effort required to investigate and implement the Densify recommendations. The displayed group effort is an average of all the calculated efforts for each instance (or service) in the group. Effort for each instance is calculated by rule-driven analytics based on factors (such as family change, storage change, data quality checks, feature changes, etc.) that can be configured in the policy settings and rule set which captures best practices. See the Effort Details tab in the lower pane for additional effort details for the selected ASG. There will be an impact to the effort value for ASGs, hosting a Kubernetes cluster, and not linked with a ECS/EKS reference (i.e. has no parent). |
|||||||
|
The number of instances currently running in the ASG. This value is the number of instances running at the time of the last data collection audit and is not representative of the entire day. The value is a hyperlink that opens the In-Service Instance Details Page page for the selected ASG. This column is hidden by default. You can enable it for display, as required. See Data Controls, above. |
|||||||
|
Instance Type Updated On |
A value in this column indicates the instance type (cloud) or instance request/limit values (container) has been change recently. The workload for this instance, on which the recommendation is based, includes only the days of data from the indicated date to the current date. All historical data for this instance, collected prior to the indicated date is not included in the analysis. The data has been excluded because it was based on the previous instance type (cloud) or instance request/limit values (container). A blank cell indicates the current instance type has not changed and all available workload data within the range, defined by the policy, has been used to generate the recommendation. Contact [email protected] to enable this feature. See Relearning Workload Patterns for more details. This column is hidden by default. You can enable it for display, as required. See Data Controls, above. |
||||||
|
Total Savings ($/Month) |
Total savings based on making all of the recommended changes. This is the sum of all net monthly savings. If the number of ASGs spans multiple pages this is the total for all pages. |
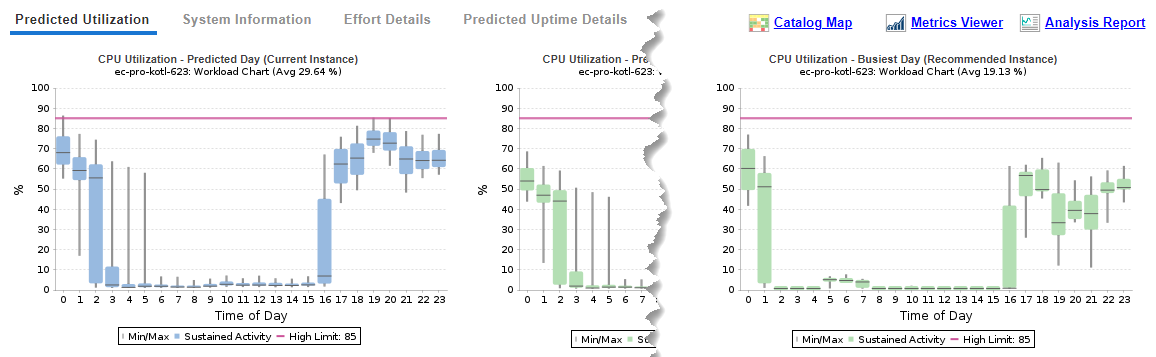
In-Service Instance Details Page
You can access this page using the hyperlinked value in the In Service Instances column. This column is hidden by default so you must enable it to access the In-Service Instance Details page.
The ASG In Service Instance Details page is divided into two panes:
- The top pane contains a tabular report listing details of each in-service EC2 instance that is created from a launch template or configuration associated with the ASG selected on the previous page. The running EC2 instances displayed, here are a snapshot from the last audit.
- The bottom pane contains the resource utilization metrics for the in-service, EC2 instance, selected in the top pane. The tab includes charts for CPU Utilization, Memory Utilization, Network I/O, Disk I/O).
Note: If no metrics are available, then the corresponding chart is not displayed.
These workload charts show hourly min/max and sustained activity for the selected system. Use the left/right arrows to scroll though the various workload charts.
Click the Back button, in the top-right corner of the page, to return to the parent dashboard. Do not use the browser's Back button for navigation within Densify. You will be logged out of your session.
Exporting the ASG Optimization Opportunity Report
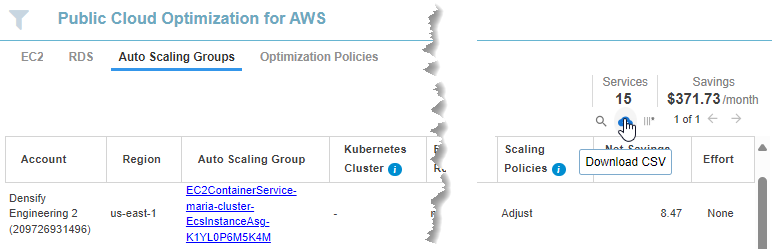
- Click the download CSV icon to export the content of the Auto Scaling Group dashboard to a .CSV file.
- From the drill-down ASG In Service Instance Details report, click the Export to Excel icon at the top-right corner to export a file in Microsoft® Excel format.
The AutoScalingGroupsSummary report contains the tabular list of ASGs from the Auto Scaling Group optimization opportunity tabular list view. All filtering options will be applied to the exported data
The resulting AsgServiceInstance report contains the launch configuration or template, instance type, minimum/maximum group size and a list of the in-service instances which correspond to the selected ASG In-Service Instance Details report.
Additional Considerations for ASG Recommendations
EKS-aware ASG Recommendations
ASGs and their EC2 group members are loaded from AWS audits and Kubernetes entities are collected via the Densify Data Forwarder from Prometheus data. Linking these entities is extremely complex as even the Kubernetes cluster names may not match.
A single Kubernetes cluster can run on one or more ASG with each ASG running in a node group within the cluster; however it is possible to skip node groups, and in this case the ASG must be linked directly to the cluster entity.
Densify matches, counts and links entities and ASG recommendations are made based on the established EKS-ASG associations.
If you are not collecting memory metrics, Densify provides a method to simulate memory utilization using backfill memory policy settings. Contact [email protected] for details.